

Home / Technology & AI / Excel Data Analysis & Reporting with...
Excel Data Analysis & Reporting with Copilot AI
Data-Insights · Efficient Worksheets · Now with AI

Level of course:
Intermediate
Delivery:
In-Person Learning
Duration:
/ 2 days
Upcoming Course Schedule:
29-30 Oct 2026
22-23 Feb 2027
21-22 June 2027
11-12 Oct 2027

Course Overview
Master Excel — from analysis and visualization to AI-assisted dashboards and start making smarter, faster decisions.
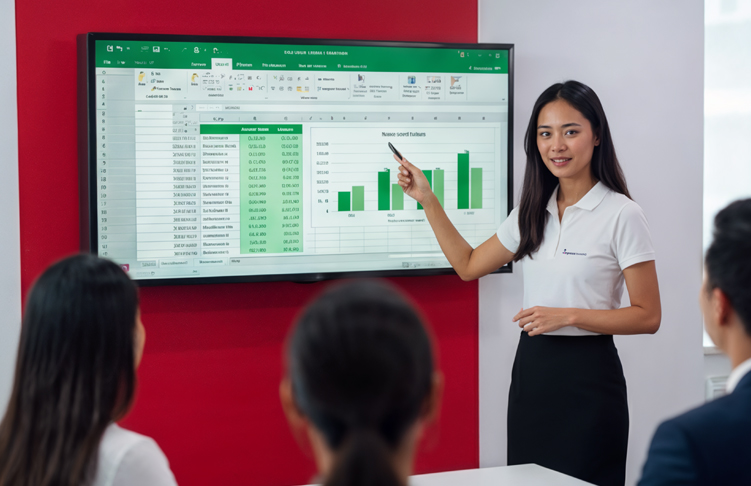
This 2-day course is designed for intermediate to advanced-level professionals who work with data and reports using Microsoft Excel. Participants will develop practical skills in data preparation, cleansing, analysis, visualization, and dashboard creation to transform raw data into meaningful business insights.
The course addresses the increasing industry demand for data-driven decision-making by equipping learners with advanced Excel techniques commonly used in business, finance, operations, and reporting functions. By the end of the programme, learners will be able to analyse and interpret data effectively, create professional reports and interactive dashboards, leverage AI-assisted insights, and support informed decision-making to enhance workplace productivity and performance.
What You'll Learn
Who is this course for?
Executives, analysts, finance/admin staff, operations teams, and professionals handling business data
Key Takeaways
Course Pre-requisites :
This is a fast-paced, intermediate-level course, not suitable for beginners. Participants should have a solid grasp of spreadsheet fundamentals and be confident creating and using complex functions and formulas.
Topics
Here's what you get to
learn in this course
Topic 1
- Convert raw data into visual insights quickly using Excel’s Quick Analysis feature.
- Highlight high and low values instantly with Data Bars for easier comparison.
- Visualize trends and data variation using Color Scales for faster interpretation.
- Categorize performance using Icon Sets based on threshold values or KPI levels.
- Track upward or downward trends using Sparklines embedded directly in cells.
Topic 2
- Use Subtotal to automatically summarize grouped data
- Apply Custom Lists with AutoFill to speed up repetitive data entry
- Sort data using multiple levels for deeper analysis
- Sort records based on custom list orders
- Filter datasets using Search Box criteria for quick data retrieval
- Apply Advanced Filter to extract specific records based on criteria
- Use Advanced Filter to copy filtered records to another worksheet
- Extract only selected columns into a separate worksheet using Advanced Filter
- Understand and apply relative and absolute cell references
- Use Defined Names to create more meaningful and readable formulas
- Apply Logical Functions: (IF, AND, OR and IFS)
- Use Statistical Functions: (COUNTIFS, AVERAGEIFS, SUMIFS, MAXIFS and MINIFS)
- Use Database Functions: (DSUM, DCOUNT, DCOUNTA, DMIN, DMAX and DAVERAGE)
- Apply Lookup Functions to retrieve and match data: (VLOOKUP, XLOOKUP, INDEX and MATCH)
Topic 3
- Use Flash Fill to quickly split text, change text case, combine text, and format numbers or dates
- Apply Text Functions to clean and transform data: (TEXT, LEFT, RIGHT, MID, LEN and FIND)
- Use Text to Columns Wizard to split text strings and format date values
- Combine data from multiple cells using: (CONCAT and TEXTJOIN)
- Load Excel table data into Power Query Editor for transformation
- Use Power Query Editor to modify and standardize data types
- Combine Multiple Files from a Folder using Power Query
- Use Power Query Editor to merge columns and split columns for better data preparation
Topic 1
- Format raw datasets into structured Excel Tables for easier analysis and management
- Identify and remove duplicate records from tables
- Create calculated columns within Excel Tables using formulas
- Apply Conditional Formatting Rules to highlight important patterns and insights
- Sort data using Icon Sets for visual comparison
- Filter records to display the highest or lowest values
- Use Slicers to interactively filter Excel Table data
- Create charts directly from Excel Tables for visual reporting
Topic 2
- Create PivotTables and PivotCharts from Excel Tables for dynamic data analysis
- Apply different PivotTable Report Layouts for better presentation and readability
- Show or hide Subtotals and Grand Totals to control summary views
- Generate Report Filter Pages from report filters for segmented analysis
- Use Row Labels and Column Labels filters to drill into specific data categories
- Summarize values using statistical calculations such as: (Sum, Count, Average, Max and Min)
- Calculate Percentage of Totals to analyse contribution by category
- Calculate Running Totals to track cumulative performance over time
- Group dates and numeric values for better trend analysis
- Use Microsoft Copilot in Excel to generate data insights and summaries
- Create AI-assisted charts, reports, and reporting recommendations using Copilot
- Validate AI-generated outputs and recommendations to support accurate and responsible business decision-making
Instructor
Know your course instructor
Uma Mageswari
Uma is a dynamic educator and training professional who brings a unique blend of technical expertise, curriculum design proficiency, and leadership acumen to the learning and development space. With hands-on experience in ICT and digital skills training — from Generative AI to Microsoft Excel, Power Automate, and Power BI — Uma excels at empowering learners with future-ready capabilities.
Download Brochure

Fundings & Subsidy
* Participant need to meet the attendance and assessment requirements to be eligible for the funding.
| For Singapore Citizens & PR (below 40yrs old) |
For Singapore Citizens (40yrs old and above) |
|
|---|---|---|
| Course Fees | ||
| Funding Support | ||
| Total Fee payable |
Assessments
As part of the requirement for SkillsFuture Singapore, there will be an assessment conducted at the end of the course.
Participants are required to attain a minimum of 75% attendance and pass the assessment to receive a digital Certificate of Completion issued by Impress Training along with a WSQ Statement of Attainment.
SkillsFuture Credit
Eligible Singapore Citizens may use their SkillsFuture Credit balance to offset respective course fees. This is only applicable to Self-sponsored Individuals.

The Course is very useful. Trainer was engaging and I learned a lot.
Lee Ser Hiang
Senior Manager, CPF Board
The course was very interesting and Trainer was engaging and helpful.
Cheryl Foo
Manager, Supreme Court
Very engaging Trainer and knowledgeable in this field, Training was well-structured and many useful tips shared.
Abigail Lee
Marketing Executive, ST Telemedia Global Data Centres Pte Ltd
Well designed course and had great takeaways and backed by research.
Nigel Goh
Manager, Sembcorp Industries
Mind-blowing professional training course that helped my team with techniques to structure/plan a good presentations before diving into it.
Valerie Lee
Head, Corporate Development, Sembcorp Industries Ltd
I never knew PowerPoint has so much to offer. Thank you for alerting me to its possibilities.
Seah Boon Kiat
Deputy Manager, Temasek Polytechnic
Amazing instructor that never fails to wow and amuse me with his powerpoint creations. I enjoyed the course a lot. Keep it up!
Miko Chong
Product Innovator, NCS Pte Ltd
One of the most useful courses I've attended. Many hands-on practices. Great!
Samantha Wu
Manager, Civil Aviation Authority of Singapore
Great content delivered with great energy. Lots of learnings and insights.
Rakesh Patni
Research Director, IDC Asia Pacific
This course is a MUST for any professionals who does presentations, whatever the frequency maybe. Overall lots of knowledge gained & this would be very relevant and beneficial to my career.
Rubegan Soundarajan
Plant Manager, ST Engineering Innosparks Pte Ltd
The Trainer has done an impressive job in delivery a concept and impactful course on producing and presenting business presentations. He is entertaining and delivered the course very effectively.
Roderick Leong
Manager, Nxera SG Pte Ltd
Interesting Course - Animation are more effective than we thought. Passionate Trainer!
Ong Lay Khoon
Vice President, Sembcorp Energy Markets Pte Ltd
The course is amazing. Trainer is great, has lots of knowledge and very engaging.
Alberto Resco Perez
Senior Director, Software Engineering, Singtel
Trainer is very engaging and approachable, along with excellent delivery of course content.
Cedric Ang
Associates - Investments, Fraser Hospitality
Every Minute well-spent! On a more important note, definitely seeing myself applying the learning into my daily work.
Megan Niu
Lead, Sembcorp Industries Ltd
Fun learning session, a lot of insights sharing during the training.
Song Peilin
Senior Finance Manager, Mapletree Investments


Agentic AI in Practice: Design, Build and Deploy Enterprise-Ready Agents
Topic Covered:
Agentic AI, AI Risk and Governance, Workflow Design
$1000
/ 2 days
Power BI with Copilot & AI for Data Analytics
Topic Covered:
Business Intelligence, Dashboards, Data Analytics, Visualisation Techniques
$1000
/ 2 days

Data Visualisation with Tableau
Topic Covered:
GenAI, Productivity, Technology
$950
/ 2 days